Complete project showcase: https://www.behance.net/gallery/141095187/HealthLines-from-data-to-art
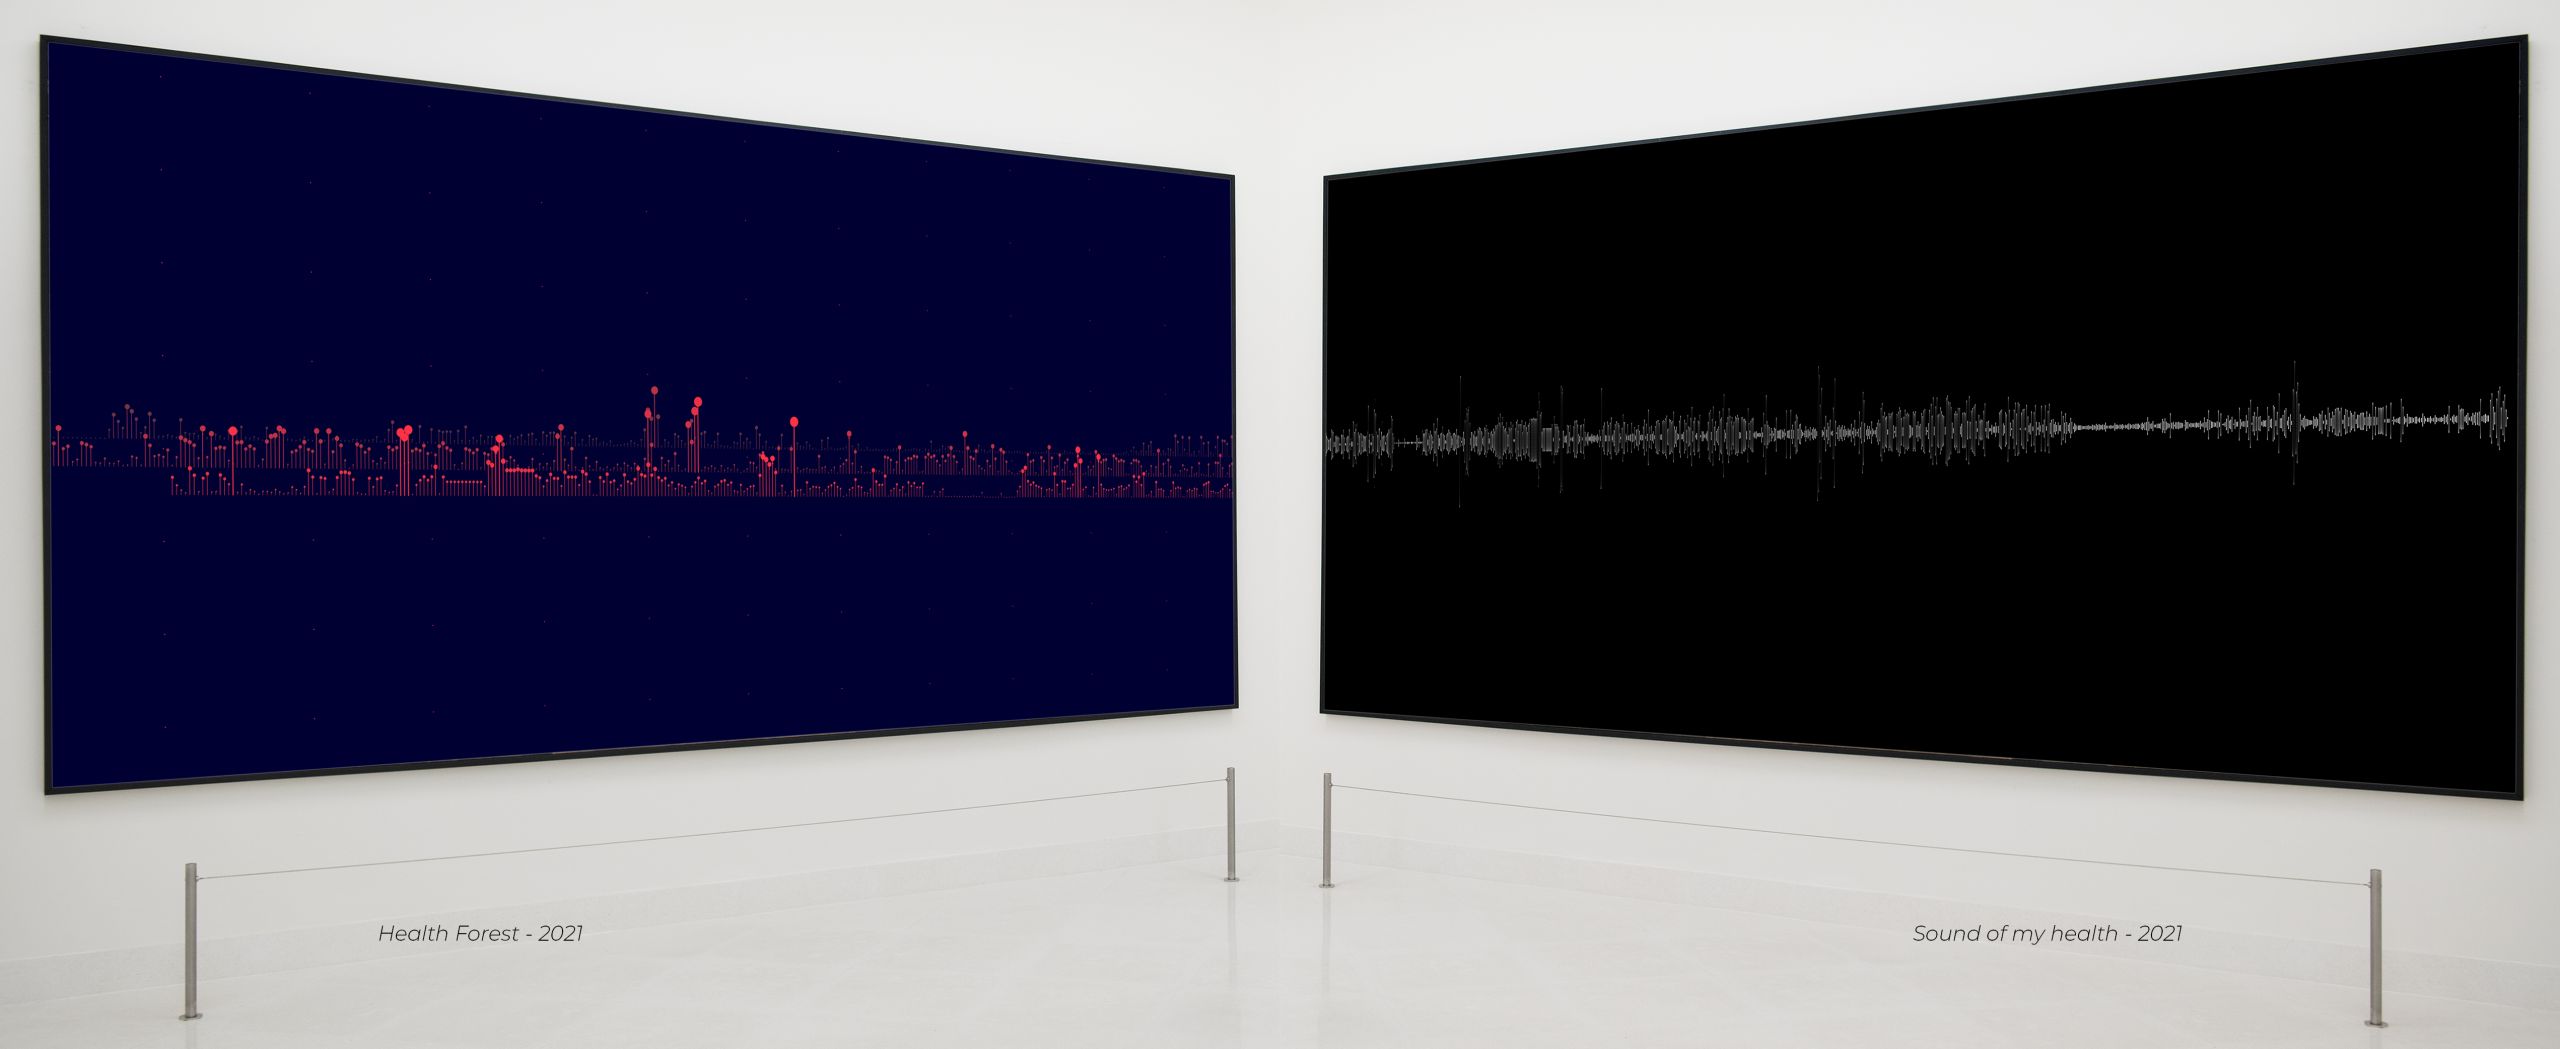
The “Healthlines” project draws on the database relating to my personal motor activity recorded (daily steps) over the period 2018-2021 through the use of the "Health" application, integrated into the iOS operating system of my iPhone. The goal is to use this data to create suggestive visual outputs, which do not necessarily express information explicitly.
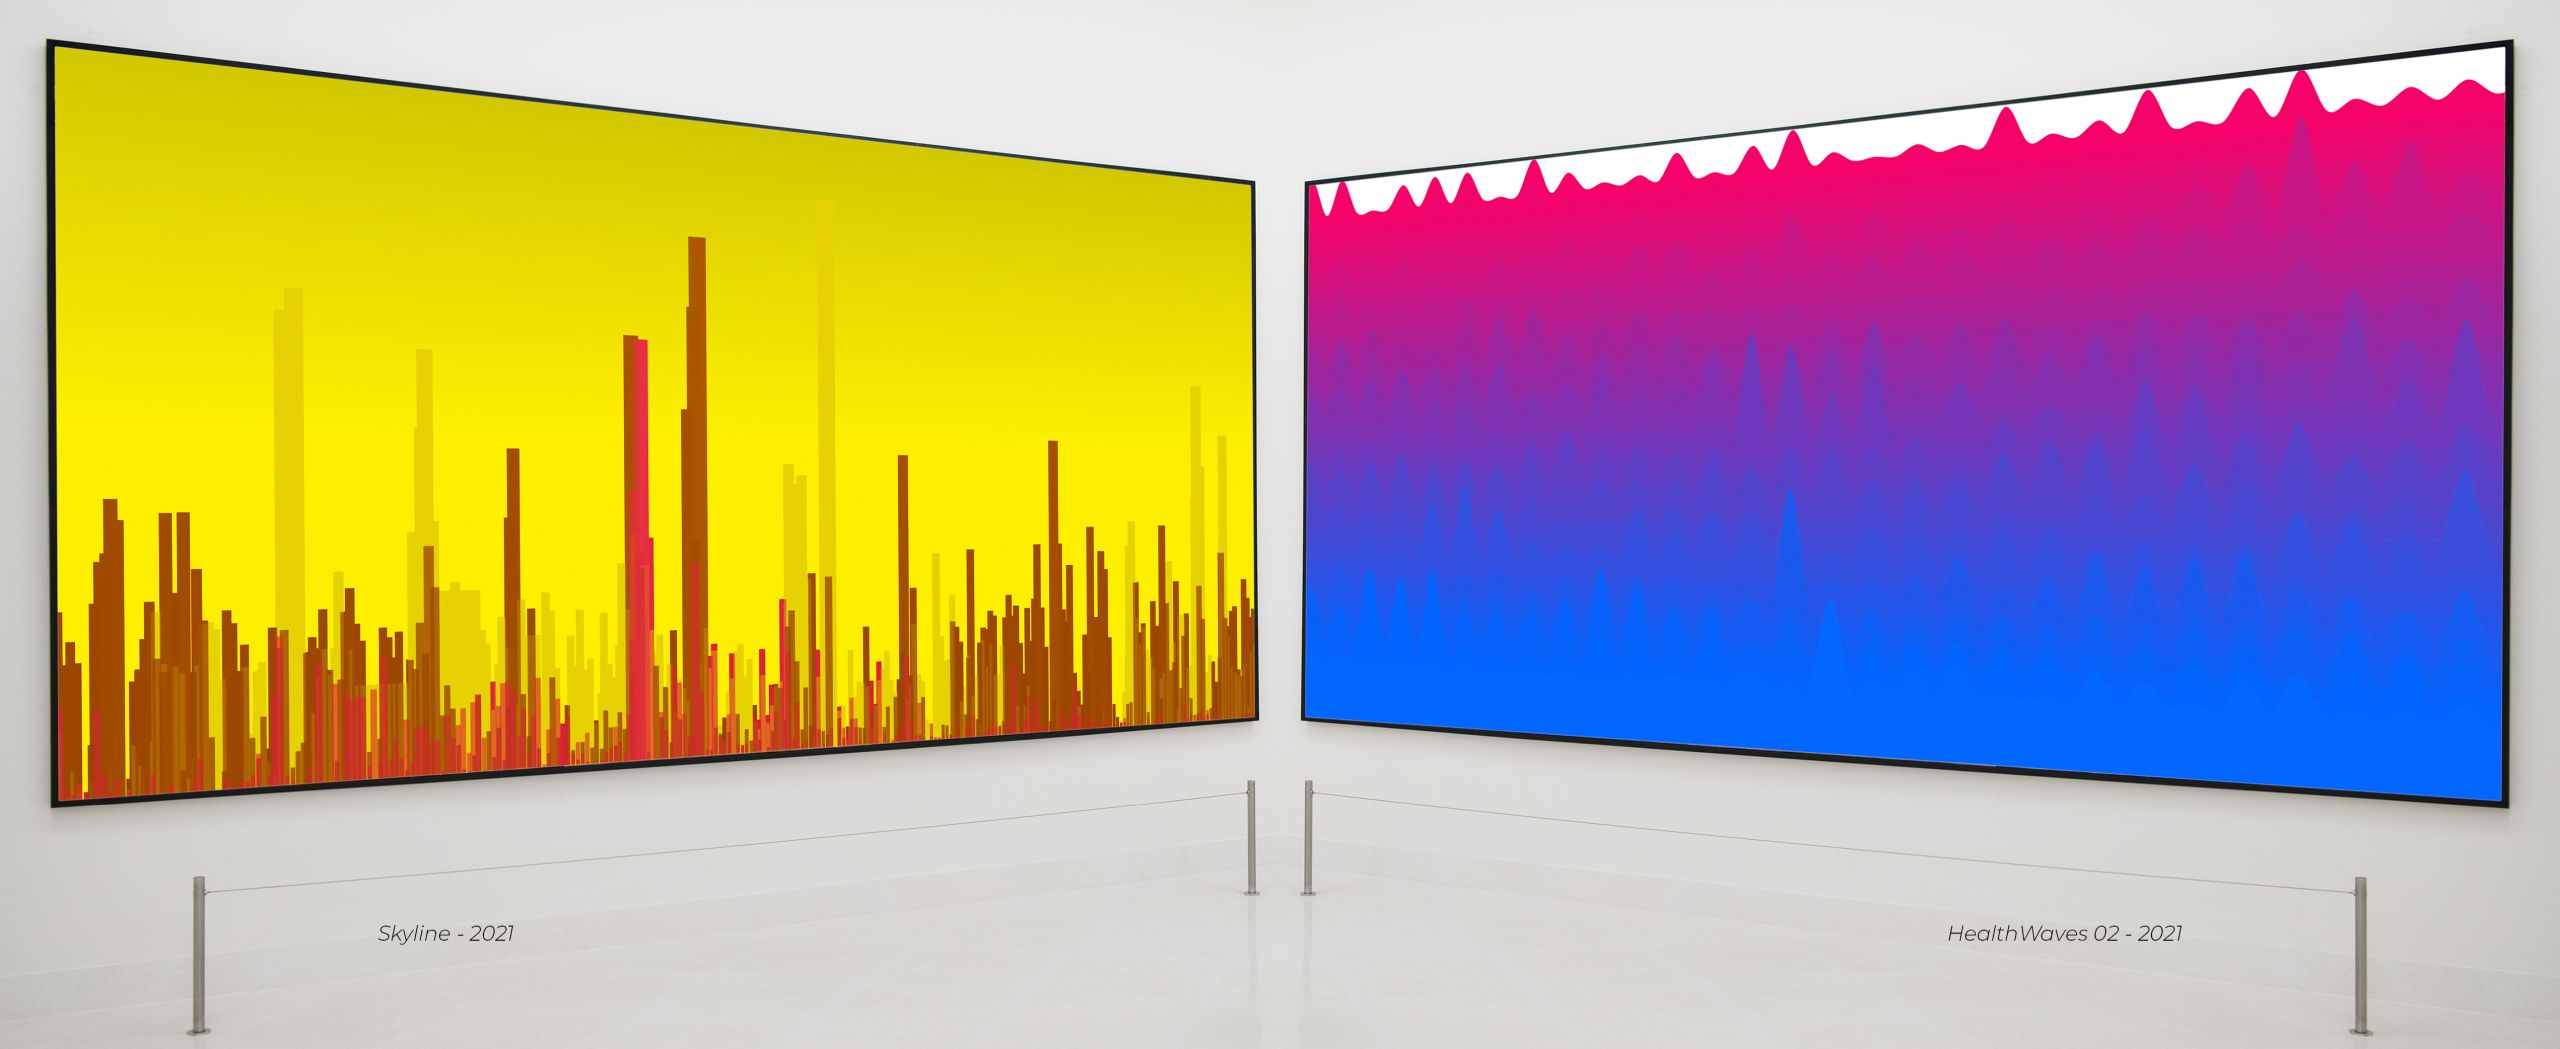
The visual composition will show through the use of lines, shapes and colors the change in daily motor activity, starting from february 2018 until the first months of 2021, thus including the lockdown period due to the Covid-19 health emergency. Precisely this last particular period will show a clear change in the timeline of physical activity, given the long period of inactivity.
The project was developed exclusively with the use of the Java programming language on Processing 4.0 open source software. The outputs are the render of the programming of the Java code. Through the export of data from "Health" application in Java arrays and the processing of customized algorithms, the project results in n. 4 artwork outputs (plus a variant) and a physical installation called "HealthWaves Solid". The outputs are the render of the programming of the Java code. Through the export of data and the processing of customized algorithms, the project results in n. 4 artwork (plus a variant) and a physical installation called "HealthWaves".
From data to code. From code to art.
Project workflow
The data at my disposal are the number of daily steps registered by the iOS "Health" application during the 2018-2021 period of time. The “HealthExport” app allows the export of data from the “Health” app to csv files. I arranged the data in the desired format using Excel for the correct formatting of the database, in order to make it usable on Processing software. Once I imported the data into Processing software and processed it through custom code by using arrays, the customized code in Java programming language organizes the available data into single integer arrays, creating visual compositions through the use of lines and colors. I have developed 4 different algorithms for the realization of 5 different outputs.
Installation
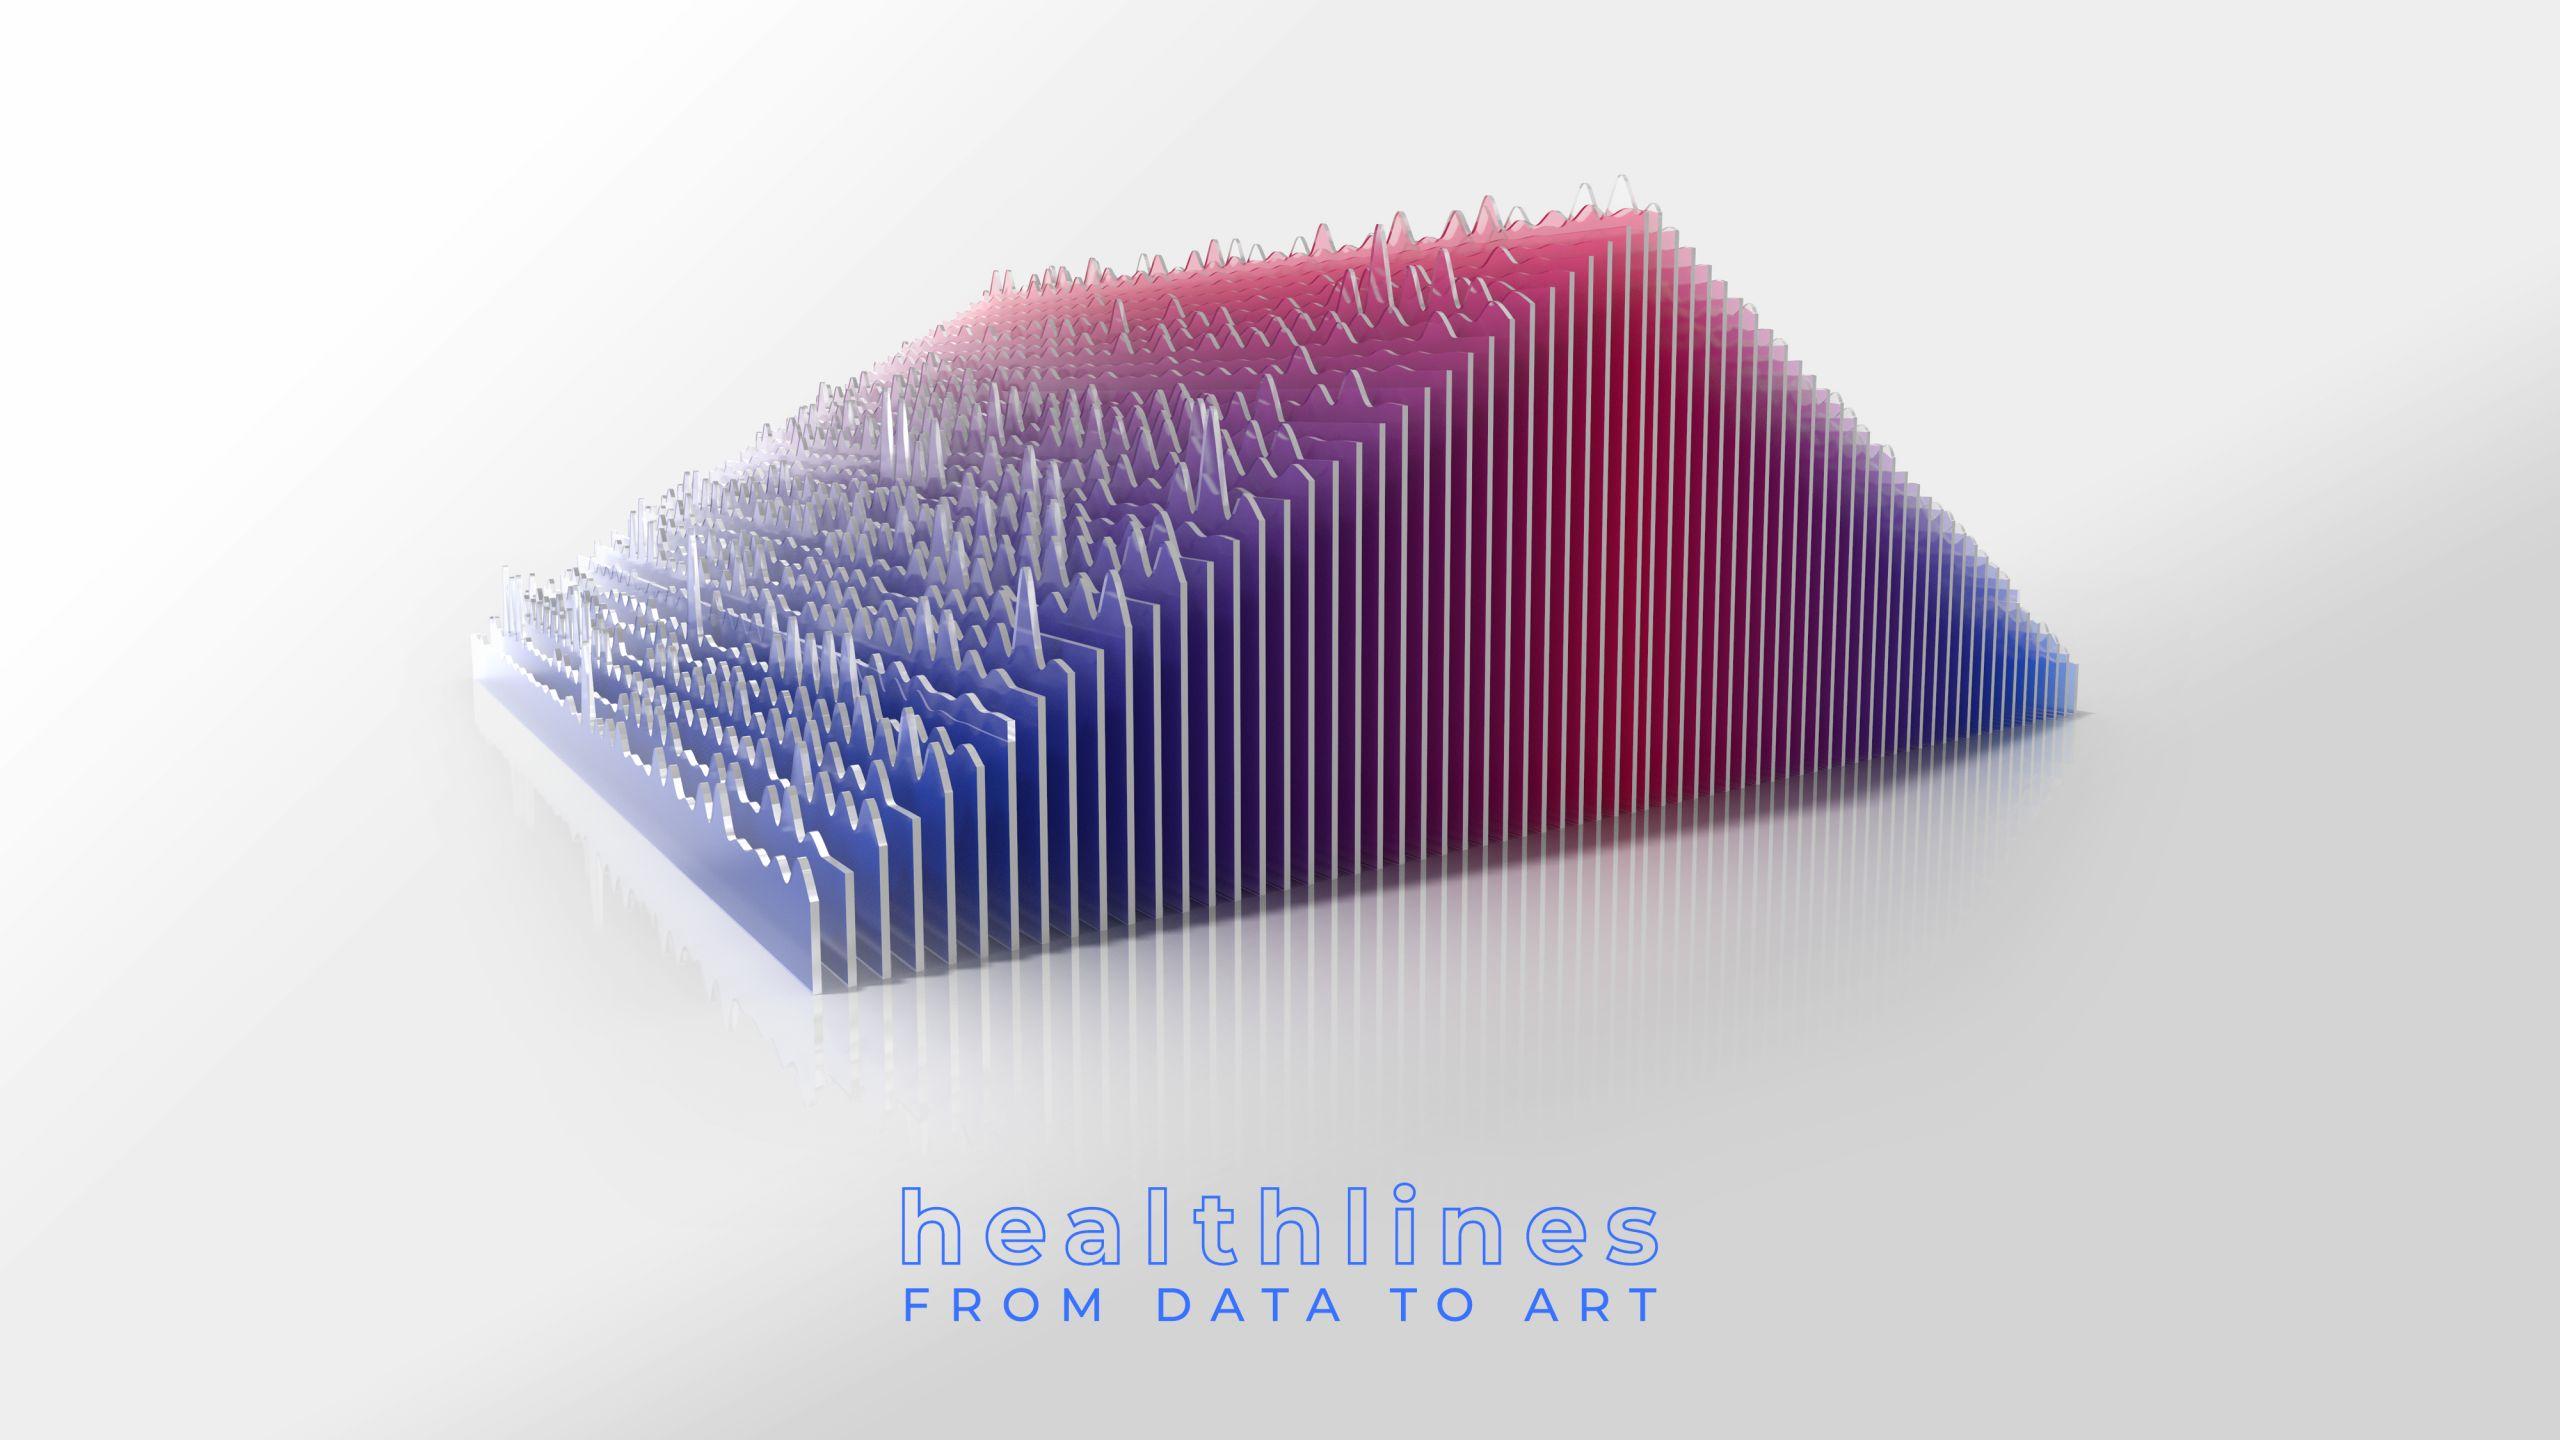
Healthwaves Solid is the striking and impacting physical transposition of the artwork “Healthwaves 02”.
The installation stems from the same algorithm as the “Healthwaves 01/02” works. The layers that make up the waves of each month are separated into individual plates, which are then printed in color on transparent rigid material. The installation is mirrored front-back so that it can be observed from multiple angles. The composition therefore provides for a total of 70 slabs, 35 + 35. It is necessary to place and use artificial lights to illuminate the installation, so as to create an effect of depth between the slabs thanks to the colors and transparency of the material.
In this installation, each month of the analyzed years represents a horizontal wavy line whose peaks symbolize the motor activity value of each single day. The growing gradient towards the viewer helps to emphasize the decline in daily physical activity in the year 2020 (here placed at the highest level). Two colors in strong contrast were used to highlight the drastic decrease in motor activity.